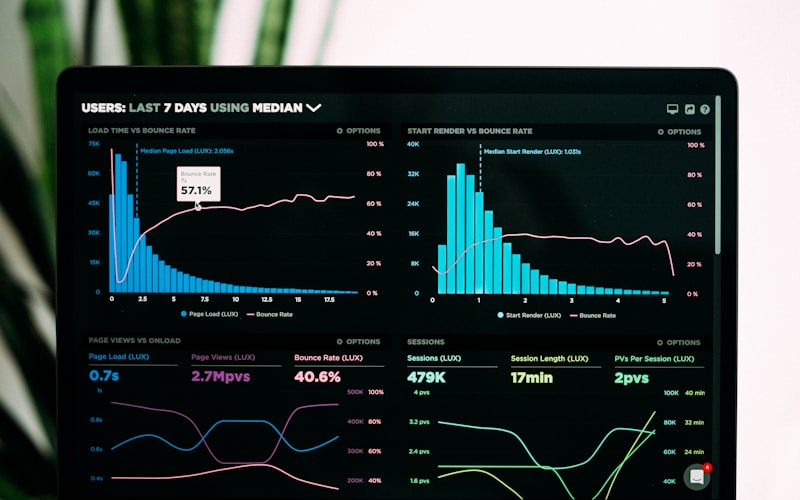
Enterprise Procurement Savings Dashboard
A full-cycle engagement to design, build, and hand over a procurement savings dashboard aligned to your category taxonomy and savings methodology.
From KRW 48,000,000 — scoped after data review
Enterprise sourcing · Gyeonggi-do
We design and deliver custom spend dashboards for sourcing directors, category managers, and CFO offices who need defensible numbers before the next supplier negotiation—not another spreadsheet buried in email.

Each engagement produces board-ready visualizations tied to your category taxonomy, supplier master data, and savings methodology—built by analysts who have sat through actual RFQ debriefs.
A full-cycle engagement to design, build, and hand over a procurement savings dashboard aligned to your category taxonomy and savings methodology.
From KRW 48,000,000 — scoped after data review

A focused four-week engagement producing annotated spend breakdowns for two to three priority categories ahead of renegotiation cycles.
KRW 18,000,000 per category cluster

Half-day facilitated sessions where your sourcing leads review peer benchmark charts and agree on negotiation targets before supplier meetings.
KRW 6,500,000 per session (up to 12 participants)

We begin with your existing spend files—SAP extracts, Coupa exports, or flat files from legacy ERP—and map them to the savings categories your team already tracks. No generic templates: every chart answers a question your steering committee asked last quarter.
Deliverables include annotated dashboard files, a written methodology appendix, and a 90-minute walkthrough with your category leads.
See report samples"Our indirect spend story finally matched what category managers were reporting verbally. The MRO waterfall chart alone changed how we prioritized the Q3 renegotiation list."
"The team needed two revision rounds on supplier grouping logic, which slowed us by a week, but the final taxonomy aligned with our SAP cost centers. That alignment was worth the wait."
Establishing a savings baseline that internal audit and category managers both accept requires documented PO-level rules—not a single spreadsheet pivot.
Waterfall charts communicate narrative; bridge tables support audit. Choosing the wrong format slows steering committees and invites finance pushback.